Samsung has been at the top of the smartphone tree for some time now, but in 2015 it dropped the ball. Not in terms of the quality of its flagship phones - that remained typically brilliant - but in the way it attempted to market two top-end handsets with the same screen size at vastly different prices. This year, in 2016, with the Samsung Galaxy S7 it's changing that, with clear air between the 5.2in Samsung Galaxy S7 and its 5.5in sibling not only on price but also on screen size.
In short, Samsung - just like Apple does with the iPhone 6s and 6s Plus - is giving its customers a clear choice. If you like your smartphones big, choose the 5.5in Samsung Galaxy S7 Edge and pay a bit more; if you don't like having to stitch up holes in your pockets every few months, the smaller, slightly cheaper 5.1in Samsung Galaxy S7 I'm reviewing here is the way to go. Either way, you're getting the best smartphone on the market.But you’re not going to do that because you’re here to find out more. You want to know exactly why it’s so fantastic. Why the design is better, the features more feature-y and the camera more capable than the compact you spent hundreds of pound on ten years ago. For more information about the Samsung Galaxy S7 head over to our sister site Know Your Mobile.

Samsung Galaxy S7 review: What’s new?
So, without further ado, here’s my review of the Samsung Galaxy S7. I’ll start with a closer look at the major changes, most of which are impossible to spot from a cursory physical inspection.
The first feature of note is storage expansion. Galaxy fans were in uproar about the lack of a microSD slot in last year’s models, so Samsung has brought back the feature here. It’s the sensible thing to do, and Samsung hasn’t compromised on the design of the phone to do it either. The microSD card is neatly hidden away next to the nano-SIM card in an elongated SIM drawer on the top edge, meaning there’s no unsightly second slot to muddy the phone’s clean lines.

The dust and water resistance is another nice feature making a comeback here that doesn’t impact on the look and feel of the phone. It’s an upgrade on the IP67 protection of the Samsung Galaxy S5, too, which was the last Samsung flagship to have the feature.
Technically, this means it’s possible to completely submerge the phone in up to 1.5 metres of water for up to 30 minutes, so you could use it to take pictures of hermit crabs in rock pools – if that’s what floats your boat.
I prefer to think of it as extra peace of mind. With the Galaxy S7, you don’t have to worry about getting your phone out when it’s raining, or putting it down on a beer-soaked table in the pub. From that perspective, it’s something that’s well worth having.
Samsung Galaxy S7 review: Specification and price
| 5.1in Super AMOLED display, Quad HD resolution, always on |
| Octa-core Samsung Exynos 8890 processor (2 x quad-core CPUs running at 2.3GHz and 1.6GHz) |
| 32GB storage |
| microSD slot supporting up to 200GB |
| Android 6 Marshmallow |
| 12-megapixel rear camera with f/1.7 aperture, dual-pixel phase-detect autofocus |
| Smaller camera “hump” protrudes only 0.46mm |
| IP68 dust- and water resistance |
| 3,000mAh battery capacity |
| Price: £567 inc VAT, SIM free |
Samsung Galaxy S7 review: Display
Aside from those headline changes, though, the Samsung Galaxy S7 is a mild update. The Samsung Galaxy S6 was, and still is, a very good smartphone, so this doesn’t represent too much of a problem.
The S7 has a 5.1in Super AMOLED display with a resolution of 1,440 x 2,560 – the same as last year’s Samsung Galaxy S6 – and it’s as sharp as sharp can be. You’d have to look at it with a microscope to see any of the pixels.
The quality of this new display is excellent. Samsung has long perfected the art of producing top-notch screens on its smartphones, somehow managing to tame the oversaturated colours typical of Super AMOLED technology, while delivering something that’s super-accurate and incredibly punchy all at once. That doesn’t change here.

Contrast is perfect, as you'd expect from a Super AMOLED-based panel. Since the individual pixels provide their own source of light, there’s nothing to leach through from behind and so you get inky, perfect black.
Colour quality is excellent. The phone has several different modes available to use, and it ships with the eye-catching Adaptive mode enabled. That’s the one I tested, and it delivers excellent figures.
With auto-brightness disabled, brightness peaks at 354cd/m2, which doesn’t look all that great. As with previous Samsung handsets, though, that all changes when you enable auto-brightness. On a bright sunny day, the screen is capable of peaking much higher – up to 470cd/m2 – so it should be perfectly readable in most conditions.
Colours are excellent. Samsung’s Adaptive mode does a great job of presenting eye-popping graphics without looking too unnatural and covers 100% of the sRGB colour space.
Samsung Galaxy S7 review: Design
Also unchanged is the glass-sandwich design and exotic, metallic finish that underpins it. In short, the S7 looks just as good as the S6 did last year – all shiny, flashy and glitzy glamour – and it looks just as awful once covered in greasy fingerprints. This is a phone you’ll be wiping on your shirt to keep clean – a lot.

Flip the phone over and look at the rear, however, and you’ll begin to see differences. First, the camera “hump” has been reduced in size, from around 1.6mm on last year’s model to 0.46mm here. It also has more rounded edges, meaning it’s less likely to catch on the edges of your pocket when you’re stowing it away, and it lies flatter when you pop it on a wireless charger, so it’s less likely to fail to charge.
Second, the vertical edges of the phone at the rear now curve up to meet the phone’s slim aluminium frame. If you keep up with all things smartphone-related, it’s just like the Samsung Galaxy Note 5, except without the stylus.

The rest of the design is fairly similar to the S6. The buttons and ports are all in the same place: the SIM card and microSD drawer are on the top edge, the volume buttons on the left, the power button on the right, and the 3.5mm audio, micro-USB port and speaker grille on the bottom.
The only other major difference is the screen’s new always-on capability. As with Motorola’s Moto Display, this shows useful information such as the time and recent notifications on the screen, even when the phone is on standby.
Unlike Motorola’s version, Samsung’s is switched on permanently, and you get a choice of what style of always-on screen is shown. There are seven different basic clock and notification views, ranging from basic digital displays to twin, world clock views. You get a choice of two different calendar views, and three images - a couple of the stars and planets, and another of stylised trees.

Having lived with the S7 for a while now, though, I’m not convinced of the usefulness of this feature. Although it’s nice to be able to see what time it is without tapping the screen or pressing the power button, the fact that it doesn’t show more detailed notifications is a big missed opportunity. Although you can see when you’ve missed a call or received a text message, you can’t see who the call or message was sent by. Come on, Samsung - I want more information.
Price when reviewed
569INC VATfrom free on a £39/mth, 24mth contract
Samsung Galaxy S7 specifications | vs Samsung Galaxy S7 Edge specifications | |
| Processor | UK spec: Most likely - Octa-core (quad 2.3GHz and quad 1.6GHz), Samsung Exynos 8890 Octa; Other regions - Quad-core Qualcomm Snapdragon 820 (dual-core 2.15GHz and dual-core 1.6GHz) | UK spec: Most likely - Octa-core (quad 2.3GHz and quad 1.6GHz), Samsung Exynos 8890 Octa; Other regions - Quad-core Qualcomm Snapdragon 820 (dual-core 2.15GHz and dual-core 1.6GHz) |
| RAM | 4GB LPDDR4 | 4GB LPFDDR4 |
| Screen size | 5.1in | 5.5in |
| Screen resolution | 1,440 x 2560, 576ppi (Gorilla Glass) | 1,440 x 2,560ppi |
| Screen type | Super AMOLED, always-on display | Super AMOLED, always-on display |
| Front camera | 5MP | 5MP |
| Rear camera | 12MP (f/1.7, 1.4μ pixel size, 1/2.6in sensor size, phase detect autofocus, OIS, dual-pixel sensor) | 12MP (f/1.7, 1.4μ pixel size, 1/2.6in sensor size. phase detect autofocus, OIS, dual-pixel sensor) |
| Flash | Dual LED | Dual LED |
| GPS | Yes | Yes |
| Compass | Yes | Yes |
| Storage | 32GB | 32GB |
| Memory card slot (supplied) | Yes | Yes |
| Wi-Fi | 802.11ac | 802.11ac |
| Bluetooth | Bluetooth 4.2 LE, A2DP, apt-X, ANT+ | Bluetooth 4.2 LR, A2DP, apt-X, ANT+ |
| NFC | Yes | Yes |
| Wireless data | 4G | 4G |
| Size (WDH) | 70 x 7.9 x 142mm (WDH) | 73 x 7.7 x 73mmmm (WDH) |
| Weight | 152g | 157g |
| Dust and water resistance | IP68 | IP68 |
| Operating system | Android 6 Marshmallow with TouchWiz UI | Android 6 Marshmallow with TouchWiz UI |
| Battery capacity | 3,000mAh | 3,600mAh |
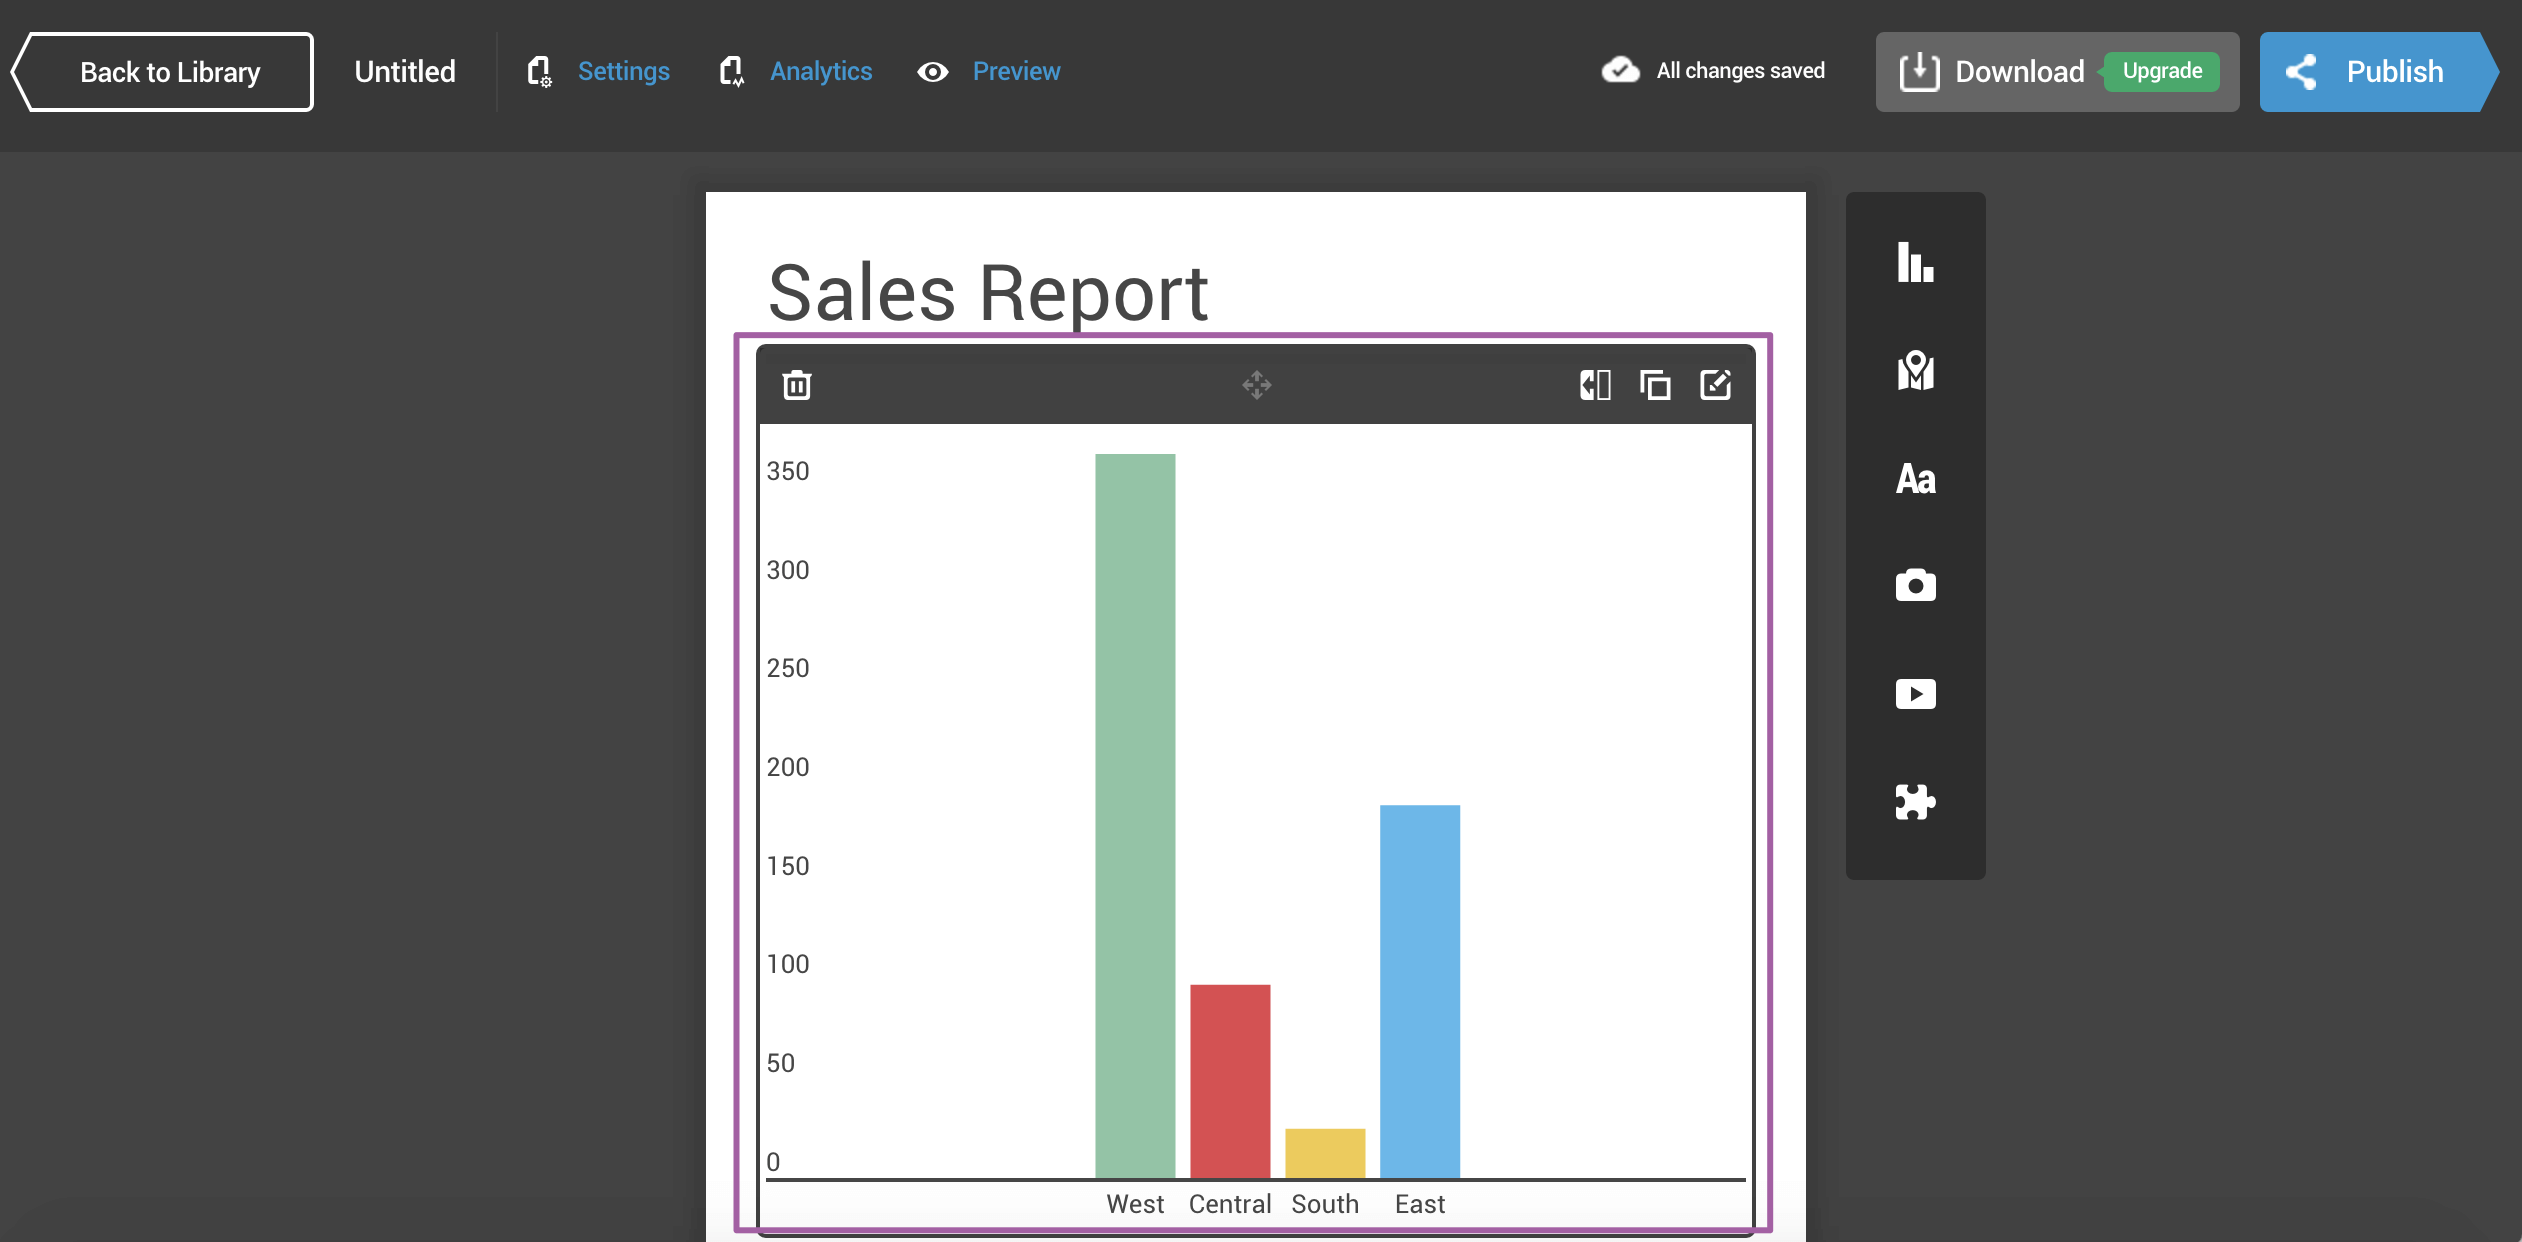
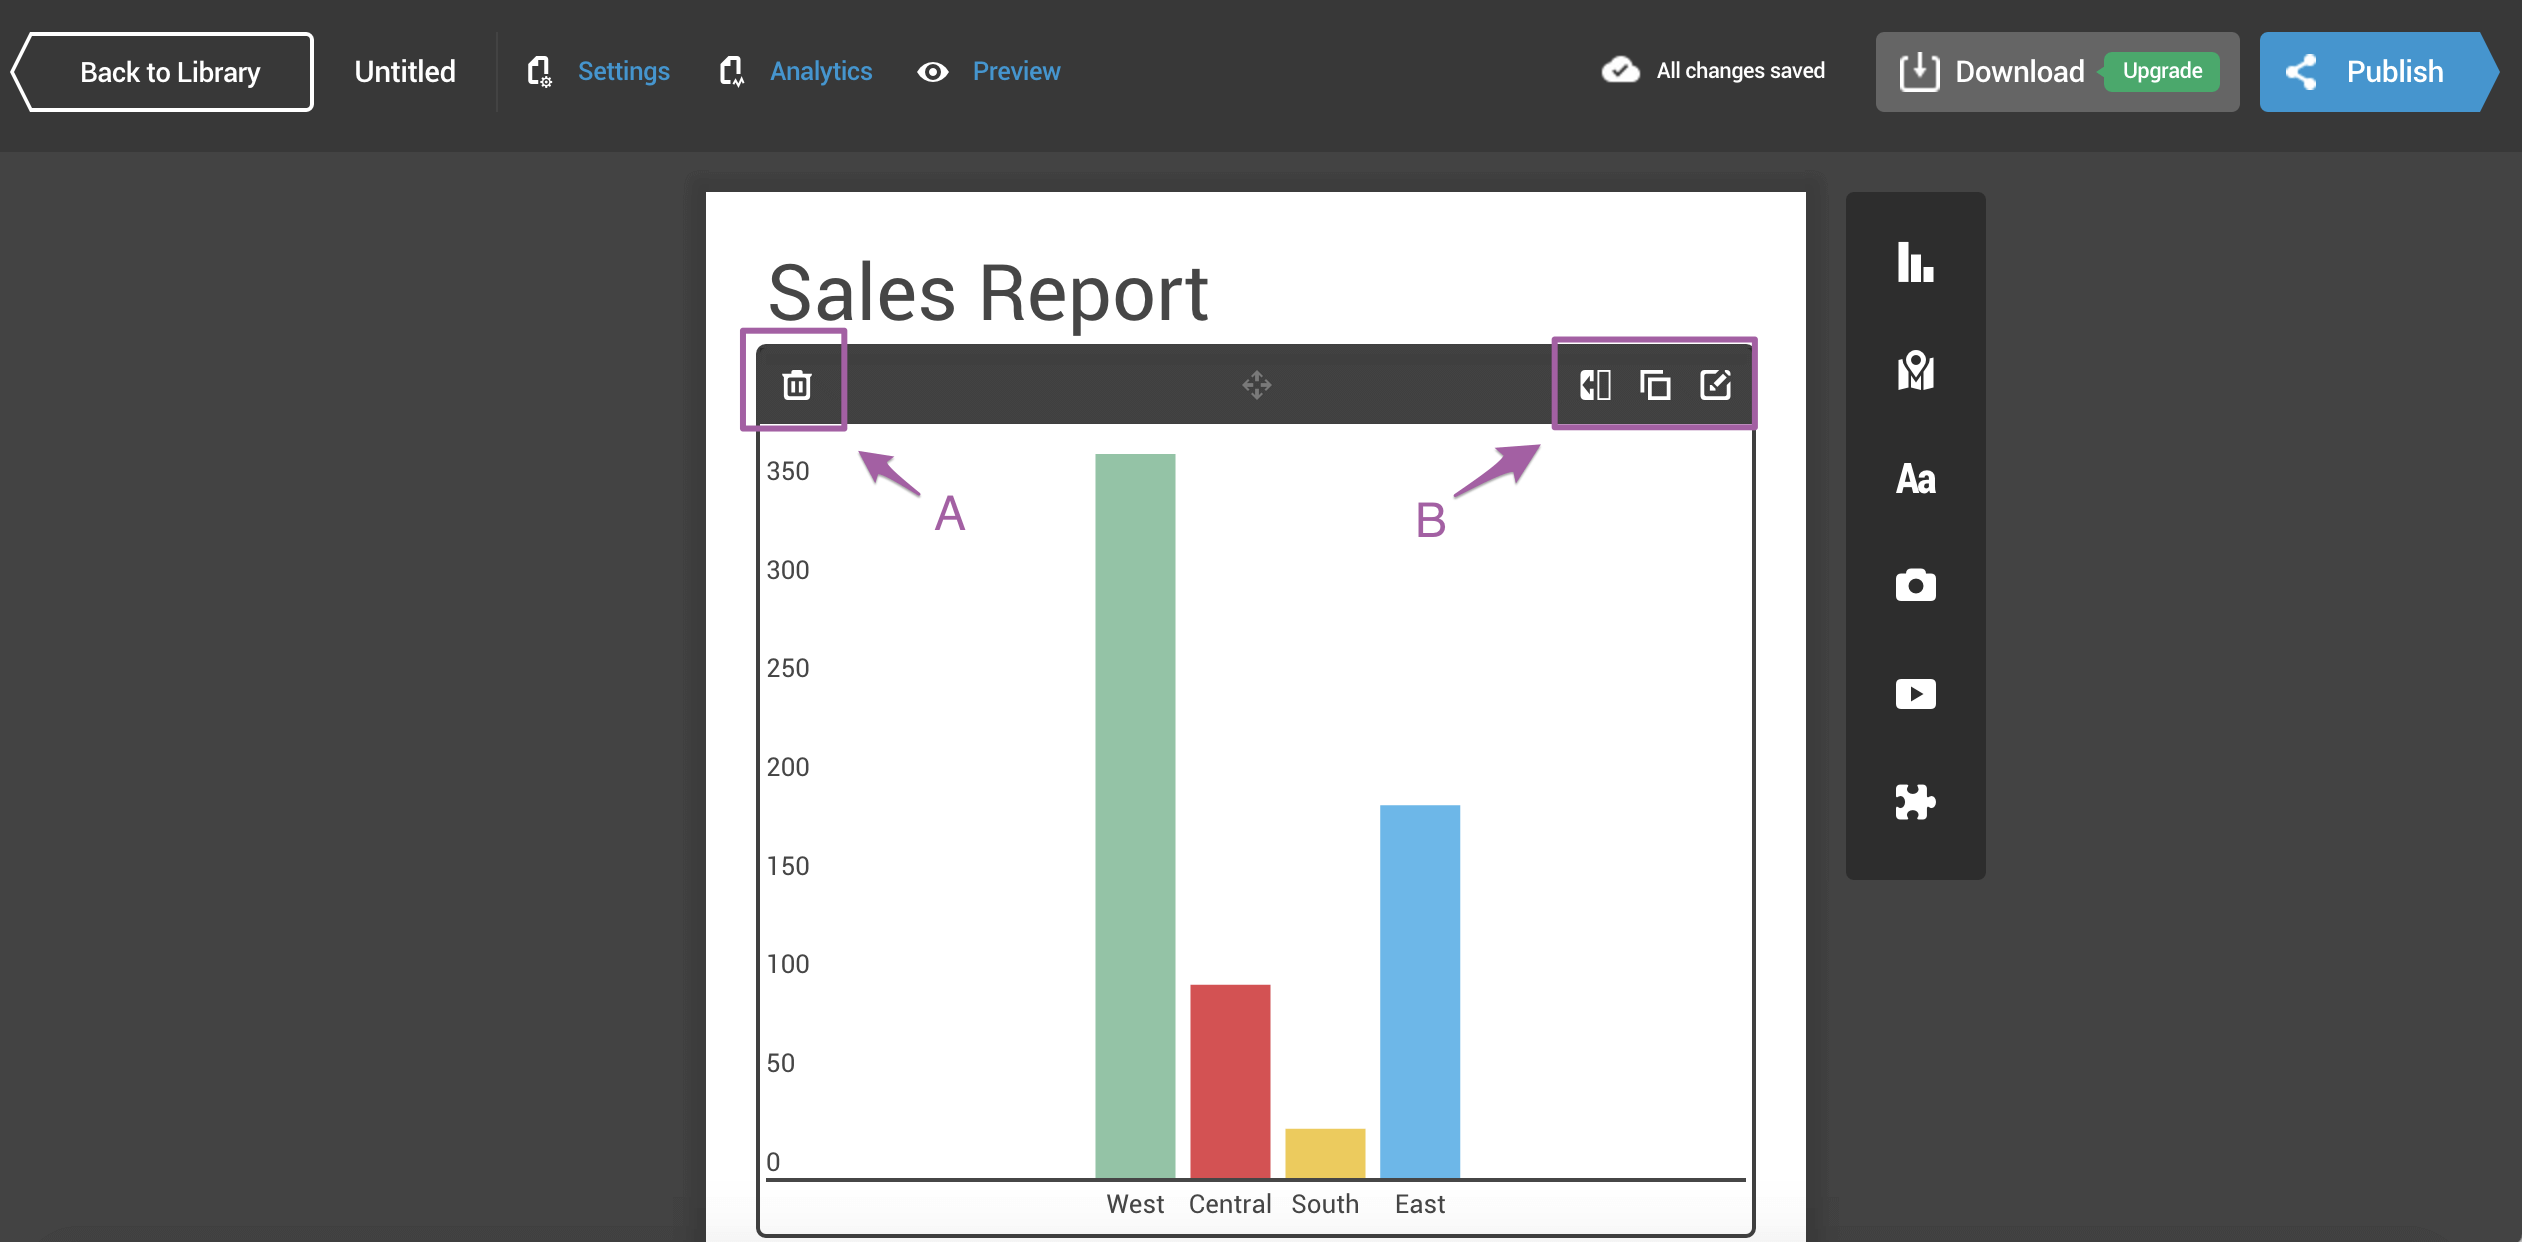
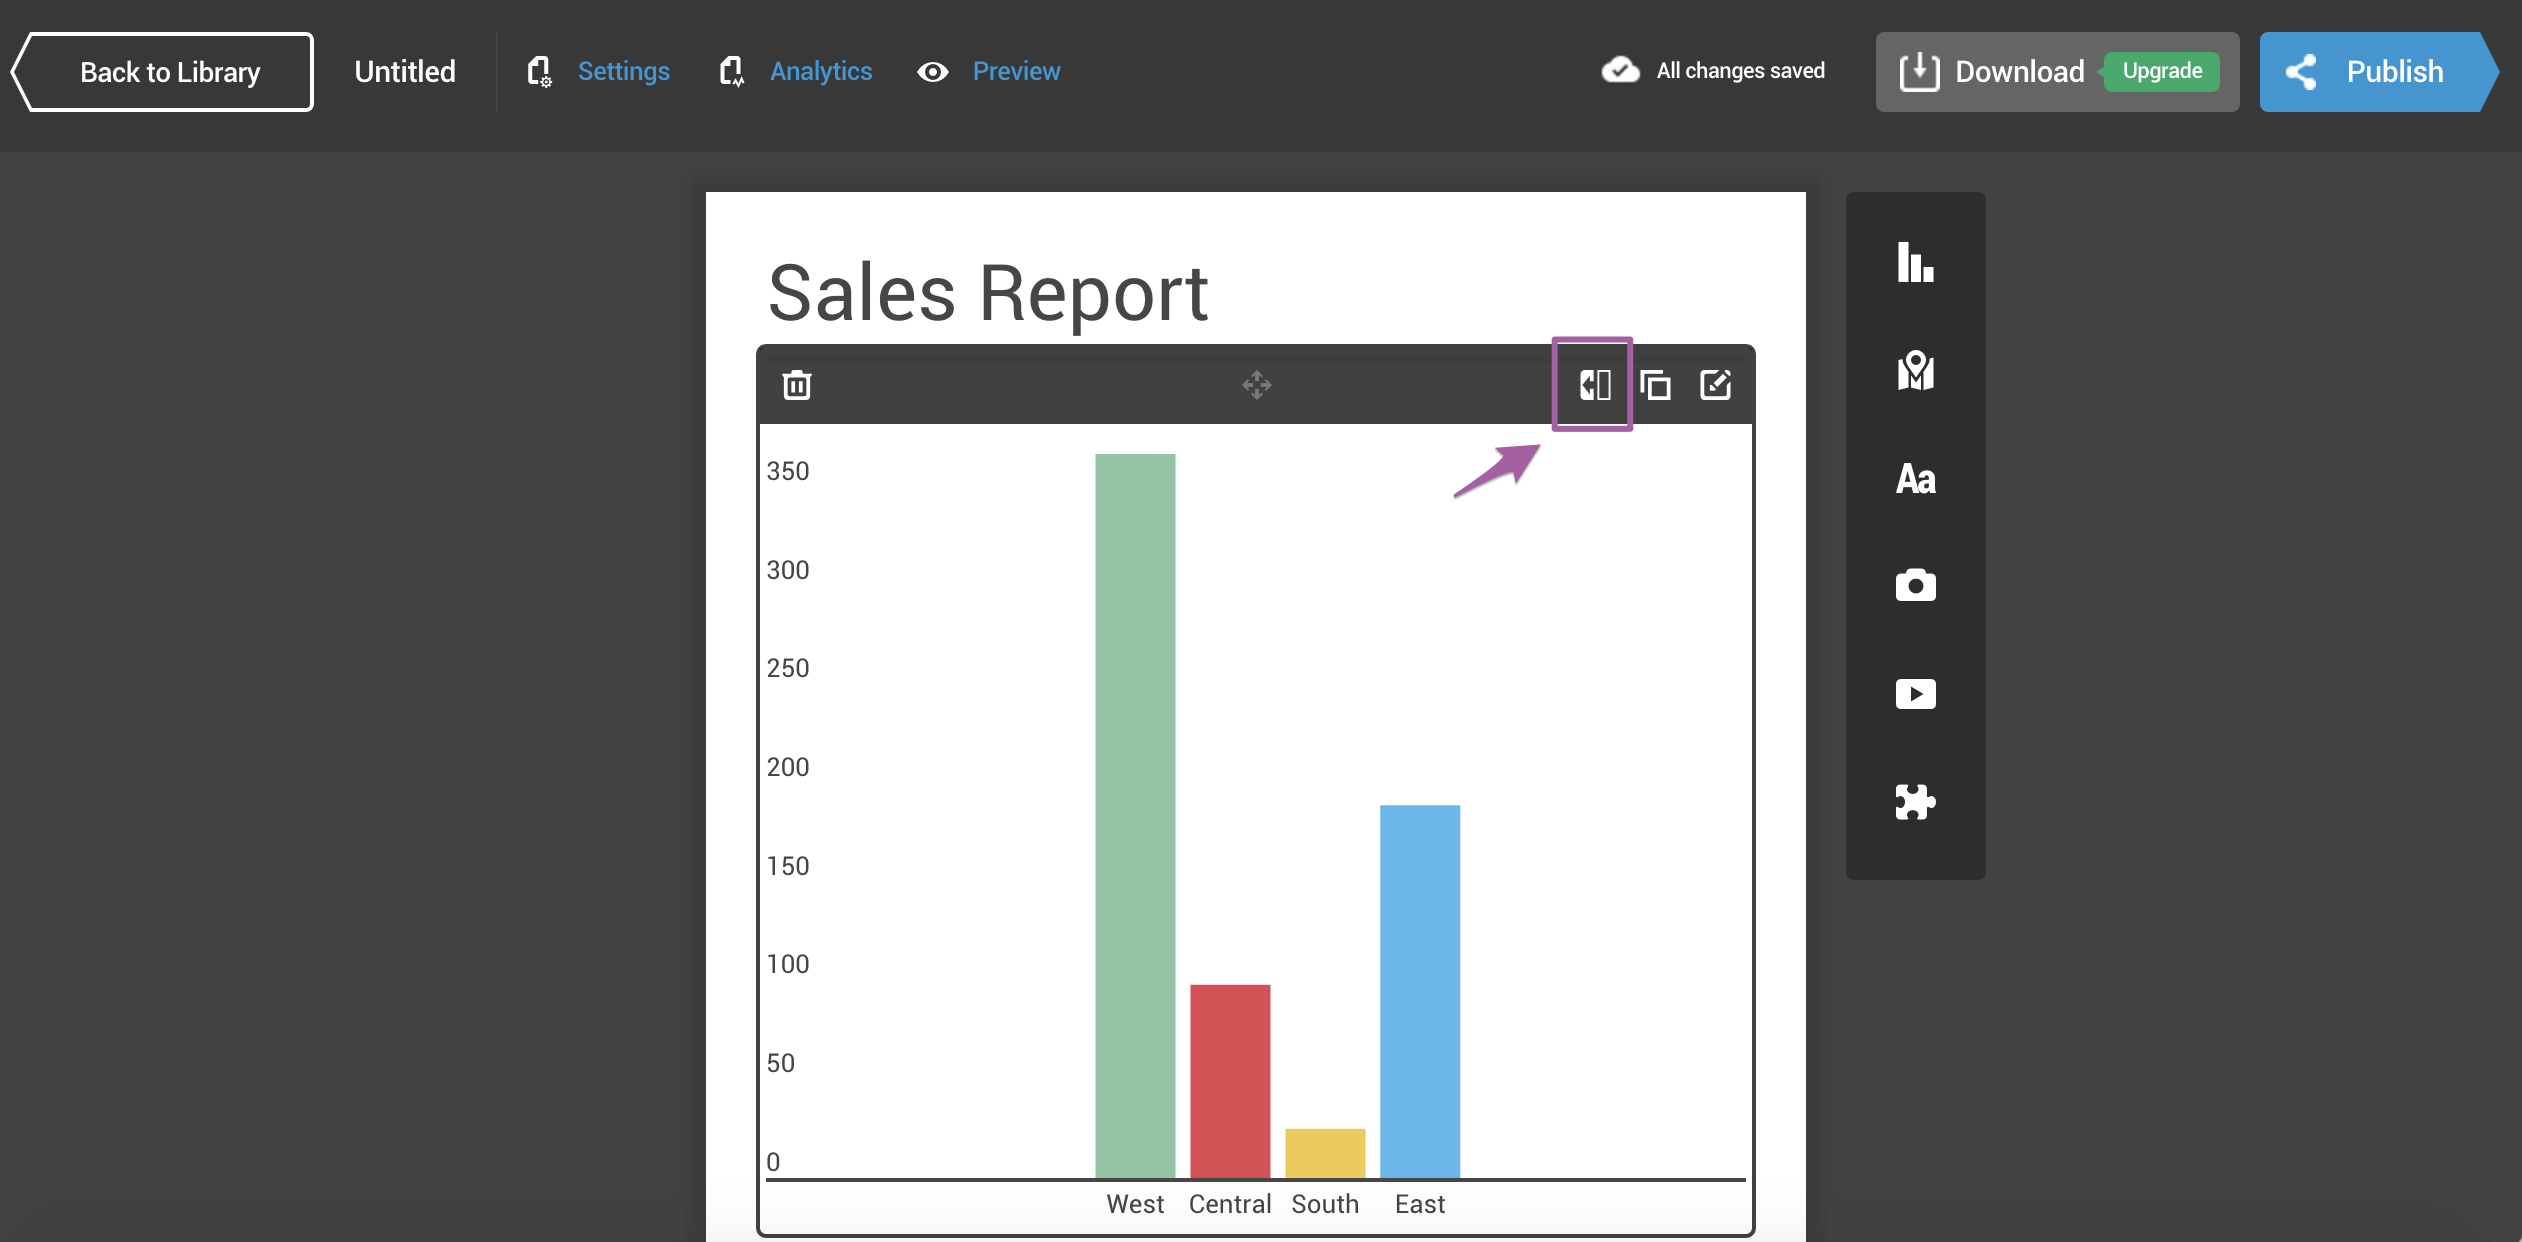
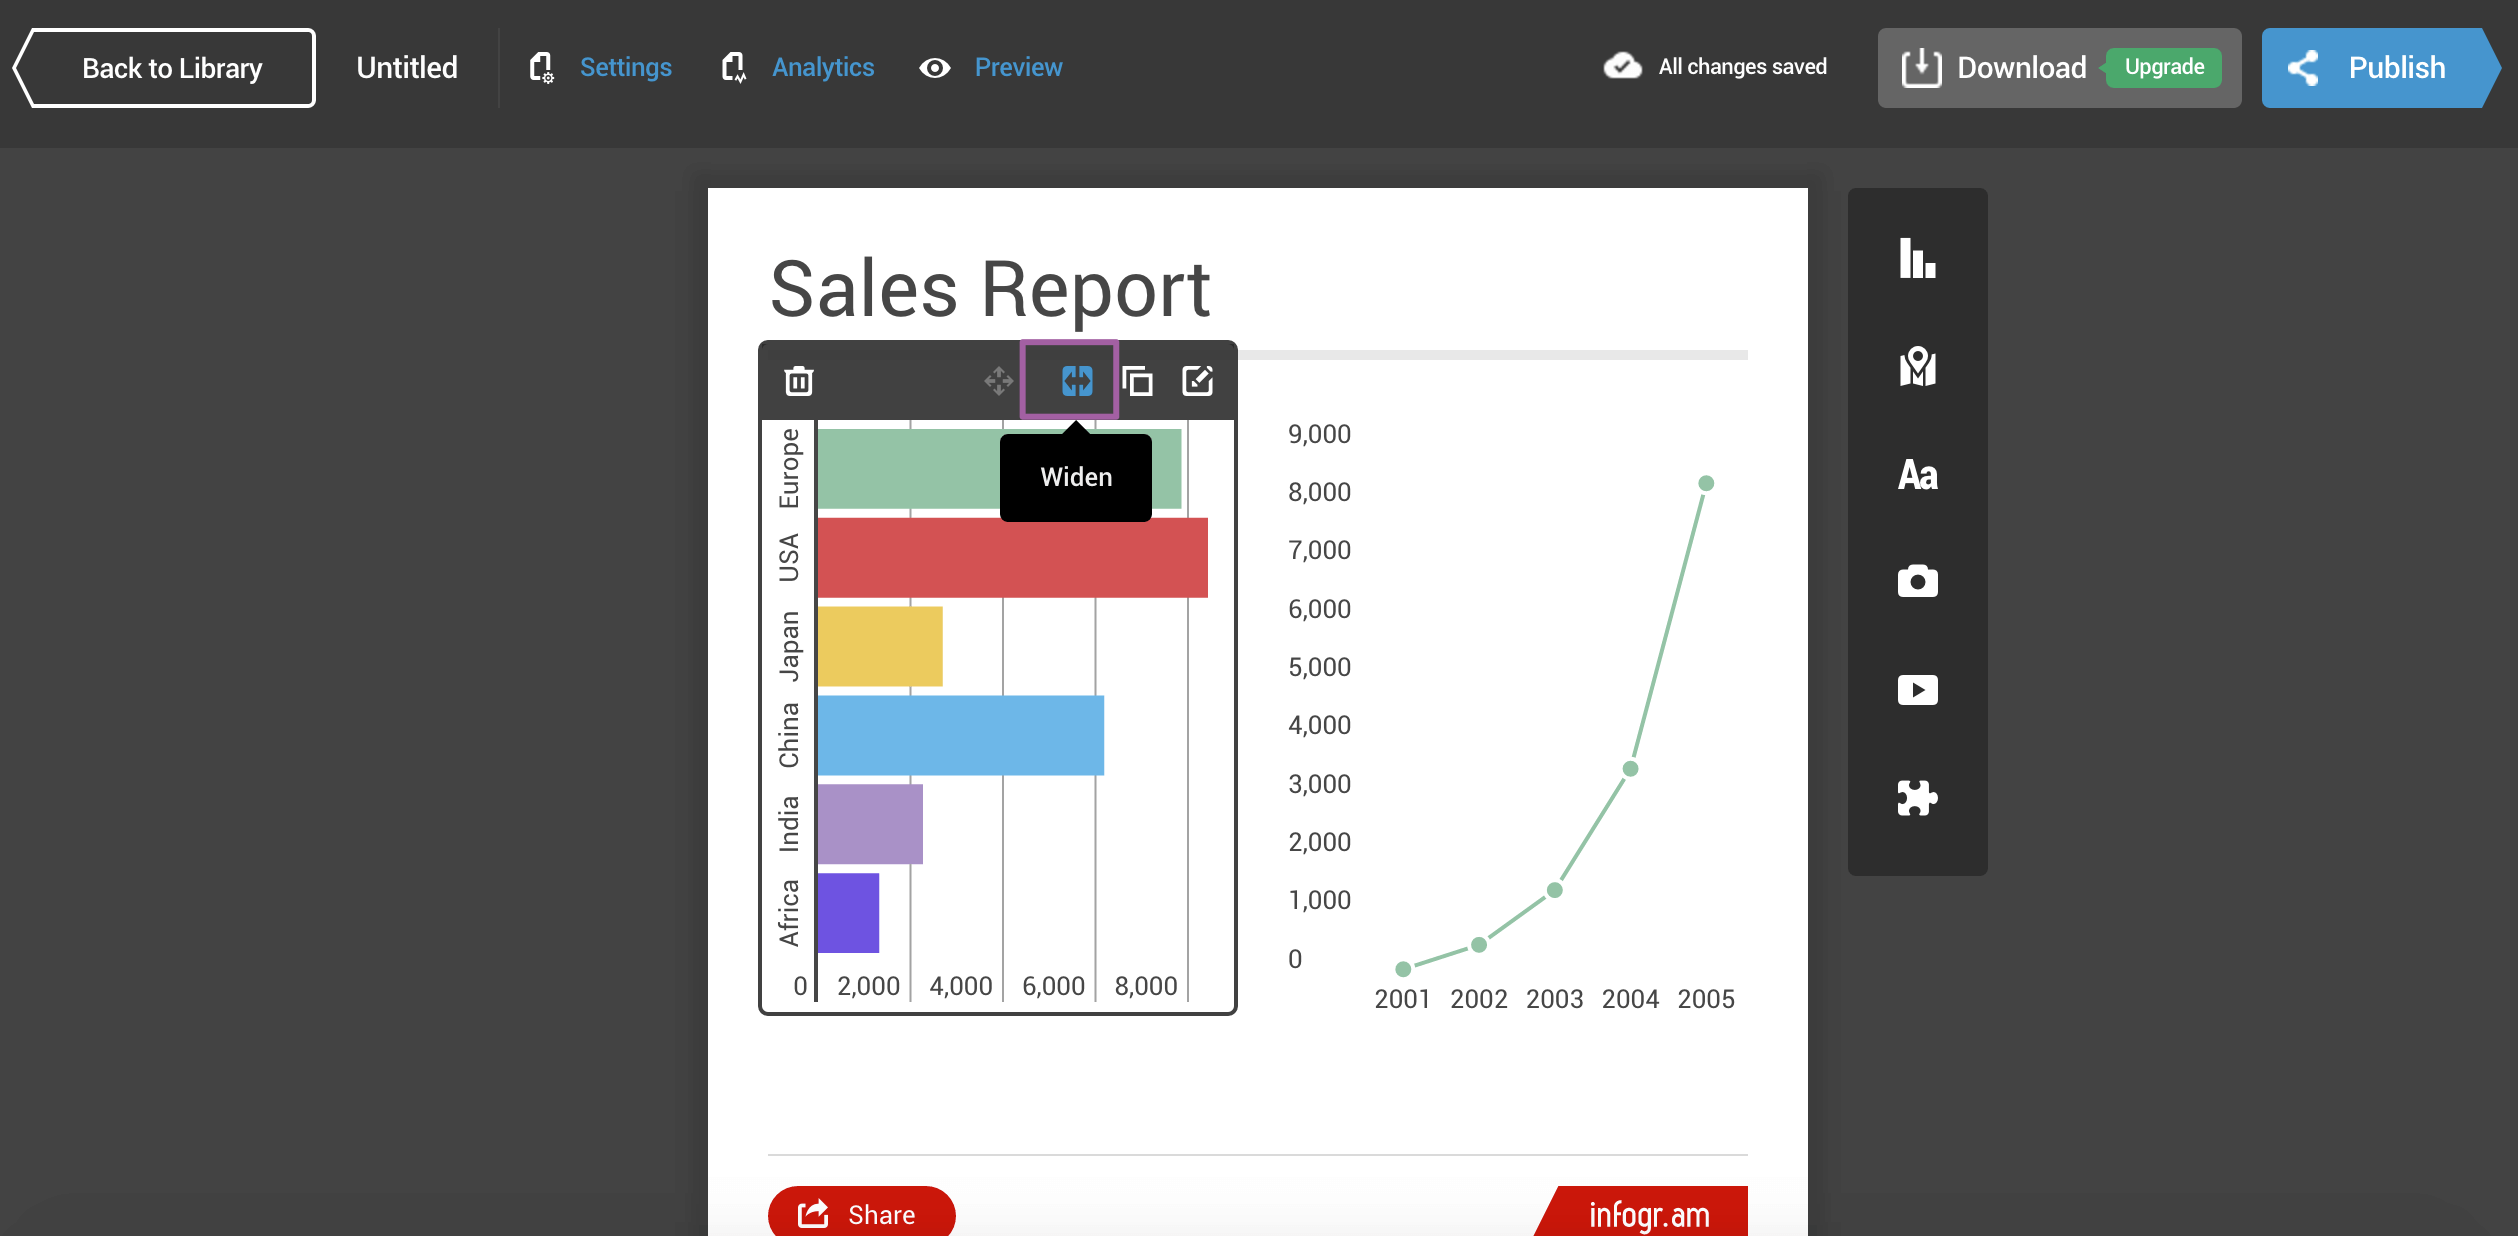
 Hover over an object to pull the object rearranging menu.