Let’s create a graph using Infogr.am. First, you’ll need some clean data to work with. You can use your own or download this practice datasetabout passengers aboard the Titanic to play around with.

At the top you’ll see the option to create a new infographic, chart or map. For this exercise we want to create an infographic with multiple elements, so we’ll click Infographic or Report.
Click on a template you like to start editing.
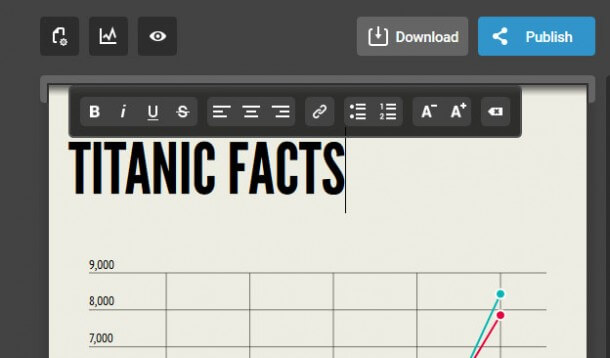
Double-click to add a title. We’re going to call this “Titanic Facts.” You’ll see you can adjust the font size, switch the alignment, make things bold, etc. – very much like you would in Microsoft Word or other text editing software (this feature is available with Infogr.am’s Premium plans). You can undo changes using the CMD or CTRL + Z keyboard shortcut.
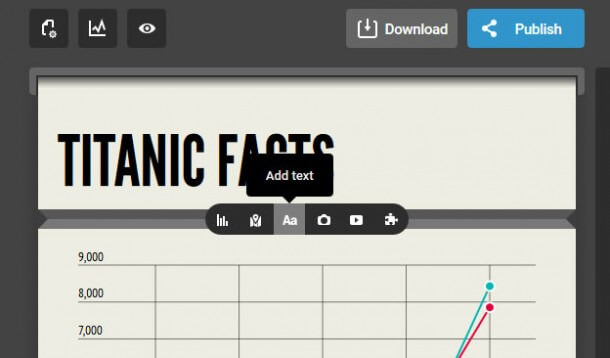
If you hover your mouse over the space between elements it will show a grey bar with the option to add a chart, map, text, a picture or video. Let’s start with some introductory text, so click “Add text”.
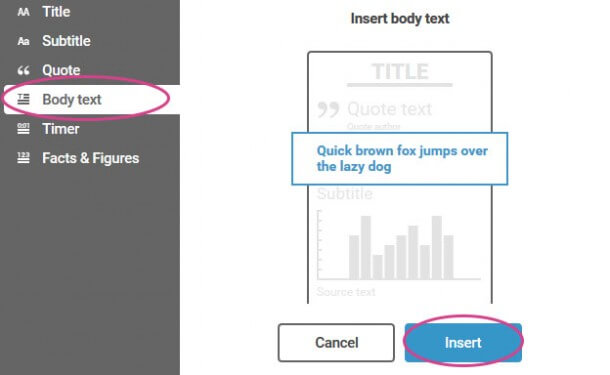
You can add different types of text – in this case, we’re going to select body text to create an introductory paragraph. Click “Insert.”
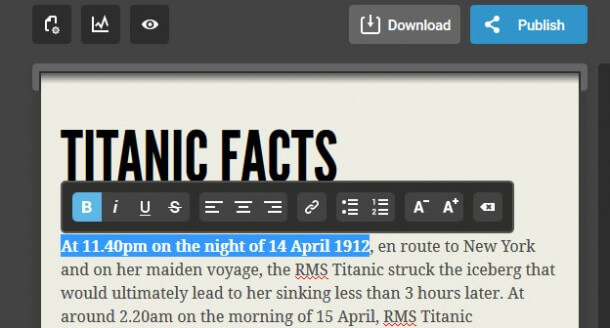
Now you can double-click to edit the text element we’ve inserted and start typing an introduction to your project.
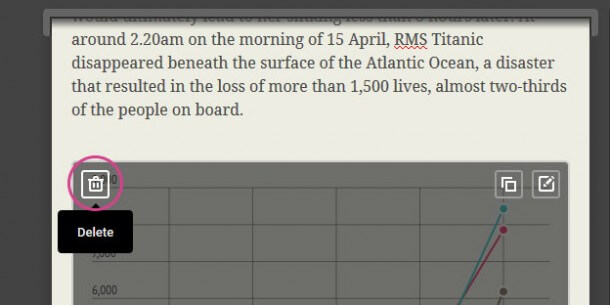
You can also delete and duplicate elements. Let’s delete the default graph and text below it.
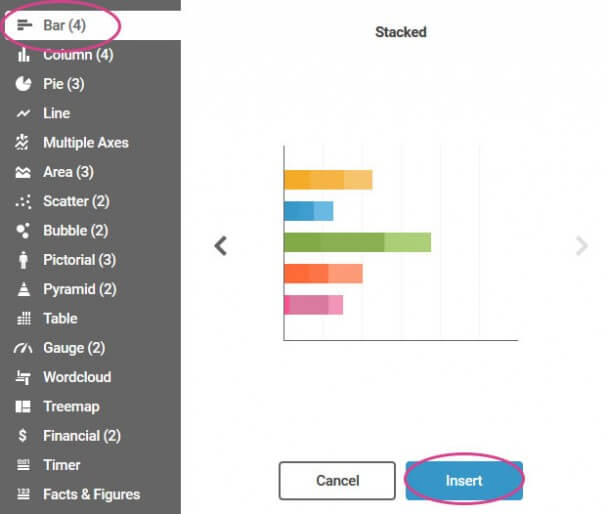
Now let’s add a new chart. We want to show the difference between survival rates of male and female passengers on the Titanic from the practice dataset, so we’ll use a stacked bar chart.
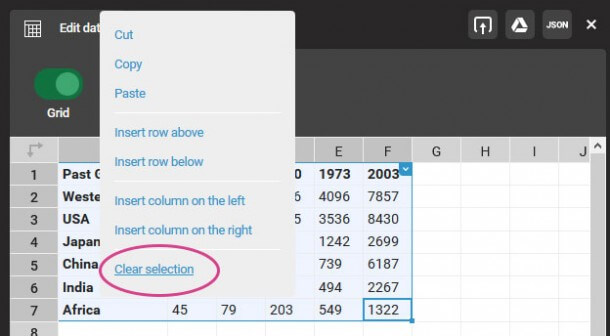
You’ll see a dummy chart has been added. Double-click to edit. We need to delete all of the existing data so we can insert our own. Drag to select all (or hit CTRL + A), right-click, then select “Clear Selection.”
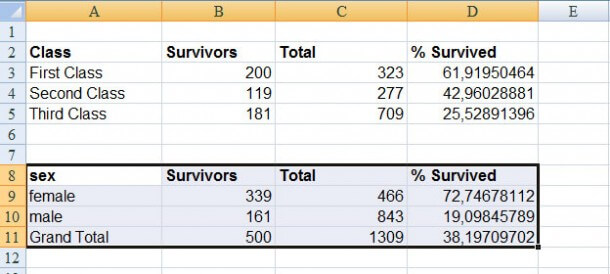
Open the Titanic dataset or your own data. In the sheet called “data for Infogr.am” you’ll see a table with information on male and female passengers. Copy this (CMD/CTRL + C). Note how these tables have been tidied up and labeled in the way we want them to appear on our chart.
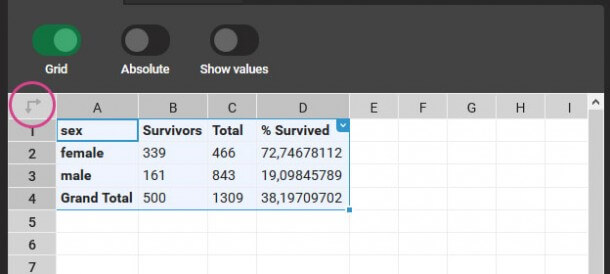
You’ll see that the chart is updated, but it’s the wrong way! We can fix this by transposing the data – swapping the columns and rows around by clicking on the transpose button at the top left.
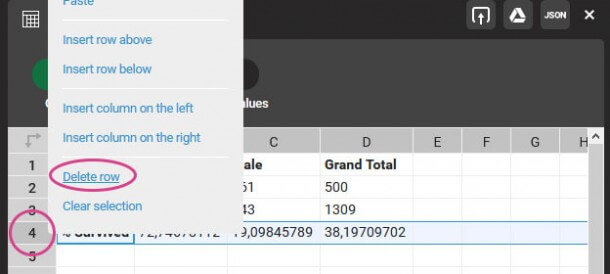
Including the percentage that survived on this graph does not make sense – the other values are in units of people, so you can’t directly compare it to a percentage. It will be better to include this separately, so let’s delete this row by right-clicking on the row number to the left and selecting “Delete row.”
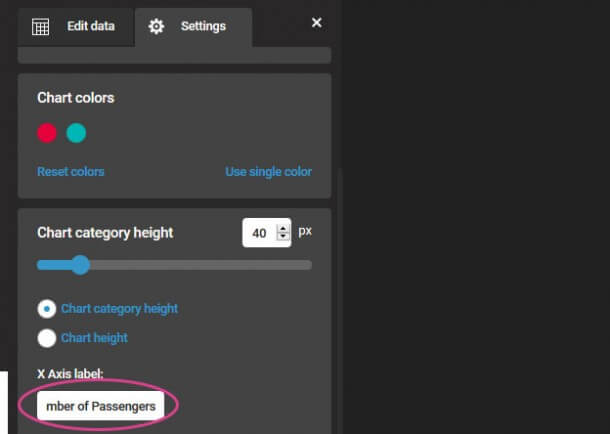
We can customize the chart by clicking on the “Settings” tab. Here you can edit the colors and size of your chart. Add a label to the X-axis (the horizontal one). It’s important to specify what your numbers represent, so let’s label it “Number of Passengers.”
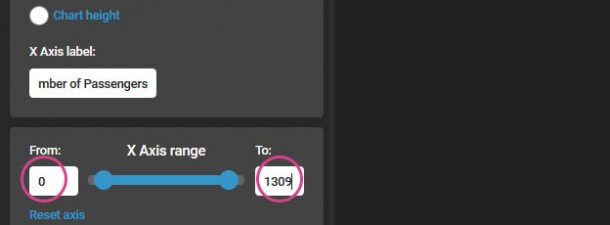
We need to make sure our X-axis has the correct range. We know from our data that the total number of passengers is 1309, so set it to “0” and “1309.”
When you’re done customizing your chart, click the close button at the top right (or anywhere outside of the editing menu).
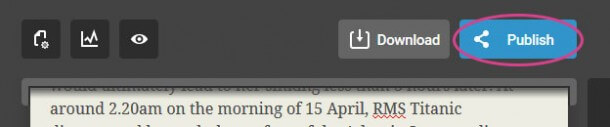
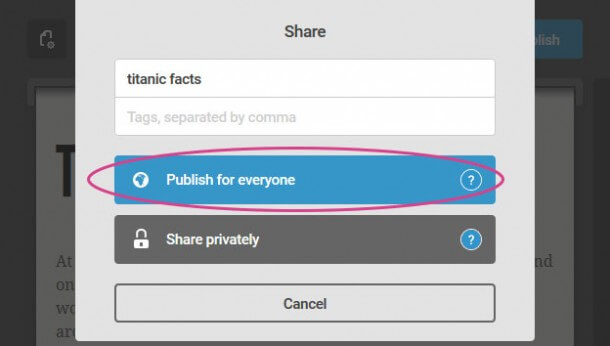
When you’re finished you can publish your infographic by clicking the “Publish” button. You can also change the title and add tags. If you want to embed it in a news article you’ll need to publish it for ‘everyone’ so the public can view it.
Now you are given a direct link to your infographic that you can share with people, as well as the embed code so you can add it to your website or blog. Copy and paste the link and your infographic is ready to share.
Here you go!