Inserting objects
There are two places where you can find objects to add to a project:
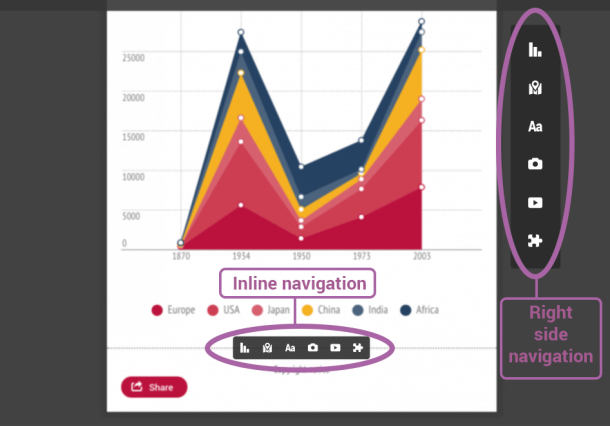
- The navigation bar on the right side. You can add the following items: charts, maps, text, photos, media and integrations from other data sources and Google Analytics.
- The inline navigation. To find it, hover over any free space on the project’s workspace. The same elements can be found there. Use the inline navigation if you want to add an element in a specific place of the workspace.
Charts
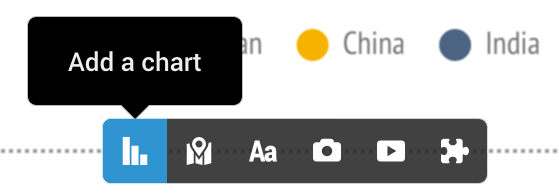
Start by clicking on the chart icon on either one of the navigation bars.
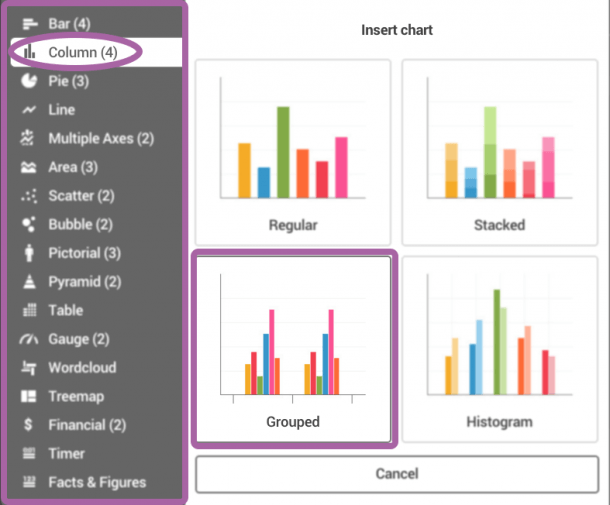
This will open a window where you’ll find a list of charts. The charts are grouped based on their chart type.
Click on any of the chart types to see all of the charts that belong to that group.
To add the one you want, just click on the image.
Maps
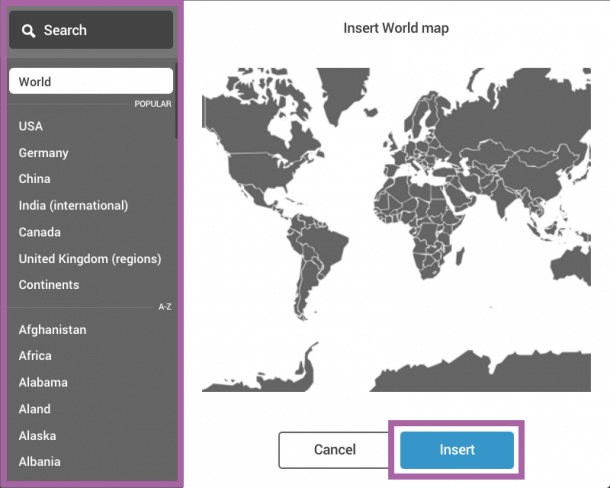
The map selector works in a similar fashion – on the left you have a large list of available maps and on the right you can see an image of what the map actually looks like. Find the right one either by browsing through the list or searching by keyword, for instance USA (regions) or Canada.
Images
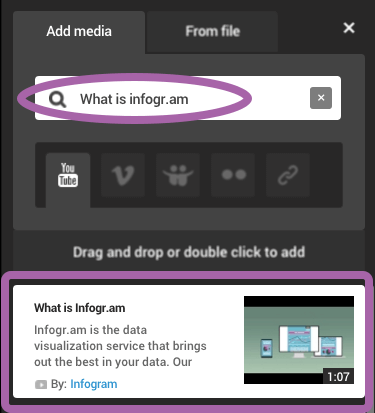
Click on the camera icon. The image selector will open on the left side of the page.
From there, you can :
- Add video and images from YouTube, Vimeo, Flickr, SlideShare and more. Enter a keyword and the system will search for a relevant image.
- You can also paste a direct link to the media you want to add.
Switch the to the From file tab to upload your own images.
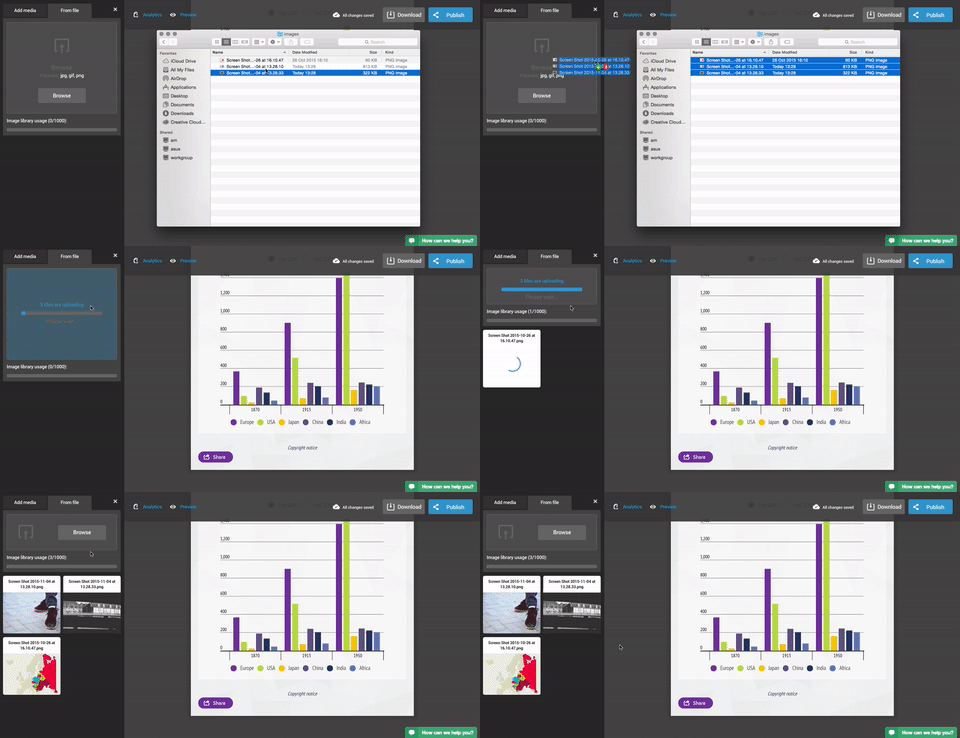
To add files from your computer or device, you can either browse your computer, or drag and drop a file into the upload dialogue.
If you’re going to work with a lot of files, it’s useful to upload them to the library. This way you won’t have to browse your computer every time you need an image. If you’re using a Basic account, you’ll be able to upload up to 10 images. To get more space, upgrade to any of our premium plans.
To add the selected image to your project:
- Double-click to add it to the bottom of the workspace.
- Drag and drop it where you want it.
Text
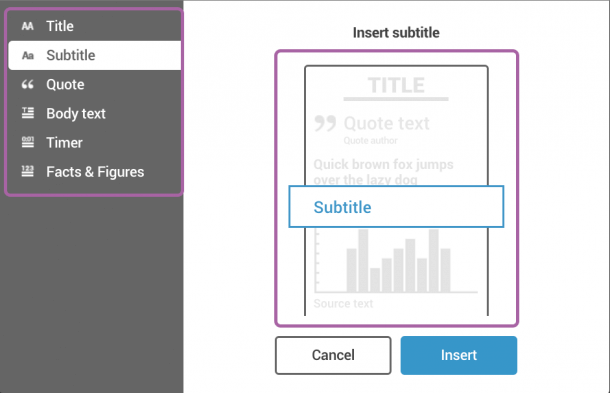
To add a text object:
- Click on the text icon.
- Choose the type of text you want: title, header, quote, body text, timer or facts & figures.
- To insert the text object, click on the image or on the ”Insert” button.
Video
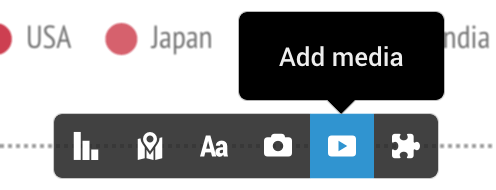
To add video:
- Click on the video icon.
- Search for videos on YouTube or Vimeo, or paste a link.
Integrations

We’ve added a few integrations to make it easier for you to find and add data to your charts.
1. Connect your Google Analytics account to create a report of your website’s traffic. With our Pro, Business or Enterprise plans you can have the data automatically updated at specific time intervals. Watch this video to learn more.
2. We have integrated into our product over 5 million data tables from the World Bank, UN, Eurostat, WHO, Yahoo Finance, U.S. SEC, FRED and the ECB. You’ll find all kinds of numbers ranging from Country GDPs to stock prices to life expectancy. Simply drag the charts to add data to your project, and double-click to format the graph. Read our article on our Global Data Sources feature to learn more.
Live data updating is only one of the features included in our paid plans. If you’d like to learn more about what you can do with our advanced features, schedule a call with one of our experts.